FCSC 2021 - The Offenders reverse engineering challenge writeup
In the context of the European Cyber Security Challenge the ANSSI organised qualifications named FCSC in order to select the team that would represent France. I managed to take a look at some challenges, in particular "The Offenders" which deals about Windows Defender. This writeup will show my quick and dirty way of solving it.
Overview
The challenge provides us a PE32+ executable and explains it was found on VirusTotal and expects to be run by Windows Defender.
After opening the executable in a decompiler, I observed that the main function does the following:
- Fetches names for some running processes
- Fetches files from the filesystem (e.g.
C:\mirc\mirc.ini) - Fetches some Windows registry keys
Then it mixes the data altogether and finally xor it with the string INPUTINPUTINPUTINPUTINPUTINPU and then xor it again with some constants. Finally, if the input data (originally INPUTINPUT...) starts with FCSC{ and the resulting data of the previous operations is equal to the string "Reminder: patch CVE-2021-1647", then it will create a file and write Congratz inside.
Thus we have the following equation:
fingerprint ^ input ^ constants = cve_string
From what we've seen, we know input should contain the flag, so if we can manage to get the fingerprinting data, we can retrieve the flag thanks to the nature of the xor operation:
input = cve_string ^ constants ^ fingerprint
From there I tried to think of the fastest way to solve this (i.e. to retrieve the fingerprint information) and it seemed obvious to me that we would have to dump it from a Windows Defender process.
Executing Windows Defender
When looking around on the internet, we can see that Tavis Ormandy made a tool mpclient which allows us to debug the Windows Defender engine (mpengine.dll) from a Linux environment. This sounds pretty cool, and after reading the readme we can start downloading a mpam-fe.exe file from Microsoft website and extract it to retrieve an up-to-date mpengine.dll with a few .vdm files which are required by mpclient.
But how does Windows Defender work after all? The talk Windows Offender: Reverse Engineering Windows Defender's Antivirus Emulator from Alexei Bulazel teaches us that Windows Defender will (among a lot of others things - by the way, you should really watch the talk) emulate the executable it analyses.
The strategy I had in mind at this point was to select a specific instruction that is easily recognisable and not executed often, put a breakpoint in Windows Defender's emulation of that instruction, patch our the_offenders.exe binary to insert this instruction right after the fingerprinting, and finally dump the content from memory.
In order to analyse the mpengine.dll and find the proper instruction handler to break to, it would be very helpful to have symbols. However the latest downloaded mpengine.dll did not have any public symbols on Microsoft Servers.
Thanks to Web Archive I was however able to download an older version of mpam-fe.exe that would give me an mpengine.dll with its .vdm files so that I can execute it with mpclient and also have the .pdb debug information file from Microsoft Servers. Here is the link for Windows Defender 1.321.1276.0 (engine 1.1.17300.4) from August 2020: web archive definitionsupdates.microsoft.com.
Breaking at the right spot
I arbitrarily decided to use the cpuid instruction as I knew it wouldn't be executed often.
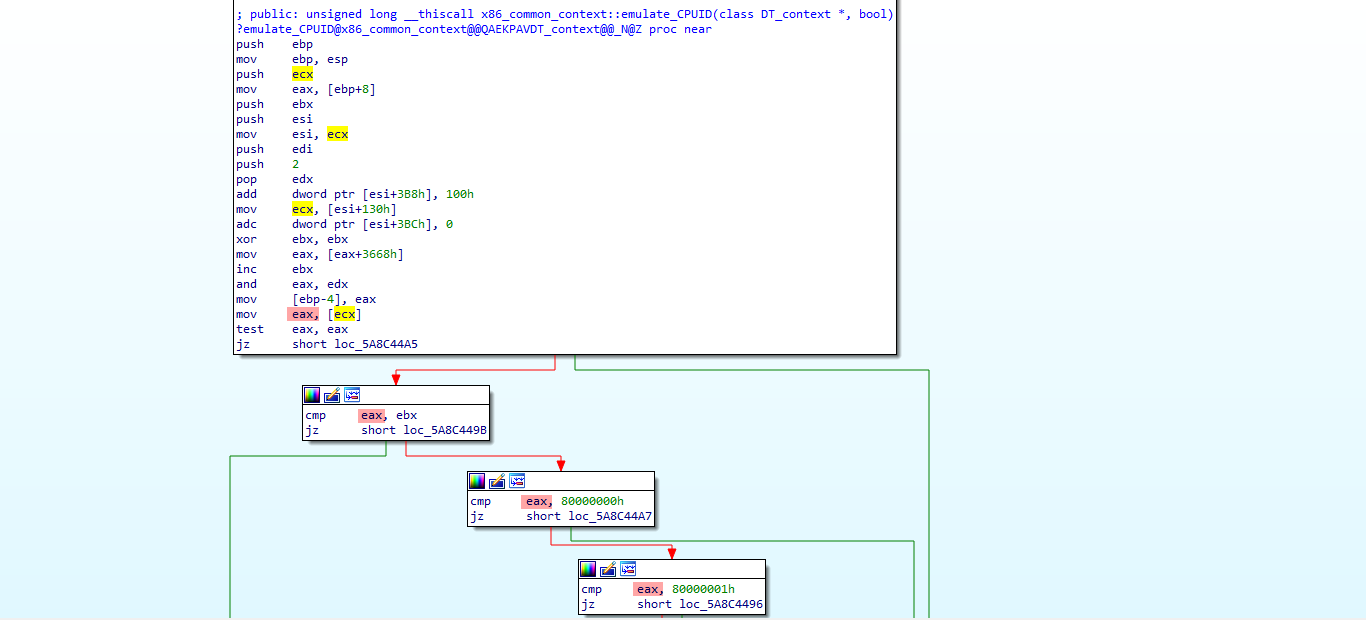
The above picture shows the function responsible for emulating CPUID in mpengine.dll. From this context we can understand it will check the emulated binary rax register with the various parameters the CPUID instruction takes into account. Note that mpclient runs only in 32 bits with a 32 bits version of mpengine.dll, but Windows Defender can emulate various architectures so it's not a problem that our binary the_offenders.exe is a x64 binary. This value is loaded from esi+0x130. With a bit of luck, this is the location where all the emulated registers are.
We can confirm this by putting a breakpoint in mpengine.dll while executing it with mpclient at the location of the CPUID emulation. We patch the_offenders.exe by putting anywhere the instructions mov rax, 0x1337; cpuid and we break in the CPUID handler in gdb:
gdb ./mpclient
...
(gdb) r /share/the_offenders.exe
Starting program: /home/ubuntu/fcsc/loadlibrary/mpclient /share/the_offenders.exe
mpclient: large number of extra symbols in engine/mpengine.map, increase MAX_EXTRA_EXPORTS and rebuild: No such process
main(): GDB: add-symbol-file engine/mpengine.dll 0x5a100000+0x1000
main(): GDB: shell bash genmapsym.sh 0x5a100000+0x1000 symbols_1769.o < engine/mpengine.map
main(): GDB: add-symbol-file symbols_1769.o 0

Program received signal SIGTRAP, Trace/breakpoint trap.
...

(gdb) b *0x5a100000 + 0x1000 + 0x7c3434
(gdb) display **(uint64_t*)($esi+0x130)
(gdb) continue
We can hit continue multiple times until the displayed value becomes the value we've set for rax in the_offenders.exe, being 0x1337.
Continuing.

Breakpoint 1, 0x5a8c4434 in ?? ()
1: **(uint64_t*)($esi+0x130) = 0x1337

(gdb) x/10gx *($esi+0x130)
0x5813a328: 0x0000000000001337  0x000000000012f5ec
0x5813a338: 0x0000000140021000  0x0000000000141f30
0x5813a348: 0x000000000012eea0  0x000000000012fff0
0x5813a358: 0x0000000000430000  0x000000000012ff58
0x5813a368: 0x000000000000001d  0x0000000000000000
We can confirm we can break at a chosen location in the binary and control the registers data.
Dumping the memory
All we want is the content of the fingerprint buffer, right before it is being xored.
0x140001B46    mov     r8d, 1Dh
0x140001B4C    lea     rdx, [rsp+10D8h+fingerprint]
0x140001B54    lea     rcx, [rsp+10D8h+registry_info]
0x140001B5C    call    sub_140002310
0x140001B61    mov     r8d, 1Dh
0x140001B67    lea     rdx, INPUT      ; "INPUTINPUTINPUTINPUTINPUTINPU"
0x140001B6E    lea     rcx, [rsp+10D8h+fingerprint]
0x140001B76    call    xor                                               ; Xor starts here, print the value before
0x140001B7B    mov     r8d, 1Dh
0x140001B81    lea     rdx, tab
0x140001B88    lea     rcx, [rsp+10D8h+fingerprint]
0x140001B90    call    xor
0x140001B95    mov     r8d, 5          ; MaxCount
0x140001B9B    lea     rdx, INPUT      ; "INPUTINPUTINPUTINPUTINPUTINPU"
0x140001BA2    lea     rcx, Str1       ; "FCSC{"
0x140001BA9    call    strncmp
We know the fingerprint data will be located in the rcx register if we stop at address 0x140001b76, so we can patch there with instructions that will load the content of the buffer at rcx into the various registers to dump the buffer content. It can be done quickly with Rizin:
$ rizin -s 0x140001b76 -w -qc '"wa mov rax, 0x1337; mov rbx, [rcx]; mov rdx, [rcx+8];
mov rdi, [rcx+10]; mov rsi, [rcx+0x18]; cpuid;"; pd 15 @ 0x140001b76-8' the_offenders.exe
            0x140001b6e      lea   rcx, [rsp + 0x730]
            0x140001b76      mov   rax, 0x1337
            0x140001b7d      mov   rbx, qword [rcx]
            0x140001b80      mov   rdx, qword [rcx + 8]
            0x140001b84      mov   rdi, qword [rcx + 0xa]
            0x140001b88      mov   rsi, qword [rcx + 0x18]
            0x140001b8c      cpuid
            0x140001b8e      add   byte [rax], al
            0x140001b90      call  0x1400024a0
            0x140001b95      mov   r8d, 5
            0x140001b9b      lea   rdx, str.INPUTINPUTINPUTINPUTINPUTINPU ; section..data
                                                                       ; 0x140021000 ; "INPUTINPUTINPUTINPUTINPUTINPU"
            0x140001ba2      lea   rcx, str.FCSC                       ; 0x1400163e4 ; "FCSC{"
            0x140001ba9      call  0x140006520
            0x140001bae      test  eax, eax
        ┌─< 0x140001bb0      jne   0x140001c3e
The rest of the instructions after CPUID are invalid (i.e. add byte [rax], al won't work as rax which will contain 0x1337 won't be a valid address) but that's not our concern since we don't continue the emulation after CPUID anyways.
We can start over the debugging session, and dump the needed values after our cpuid instruction is reached:
(gdb) x/10gx *($esi+0x130)
0x5813a328: 0x0000000000001337  0x000000000012f5d0
0x5813a338: 0x0855b177c6dcd598  0xd7008c6d417553ad
0x5813a348: 0x000000000012eea0  0x000000000012fff0
0x5813a358: 0x0000001d7f00323d  0xa4f60855b177c6dc
0x5813a368: 0x000000000000001d  0x0000000000000000
Hmm well, it seems hard to understand which value corresponds to what, but with a simple trick we can know which offset represents which register.
$ rizin -s 0x140001b61 -w -qc '"wa mov rax, 0x1337; mov rbx, 0x4242; mov rcx, 0x4343;
mov rdx, 0x4444; mov rdi, 0x4545; mov rsi, 0x4646; cpuid;"; pd 20 @ 0x140001b6e-18' the_offenders.exe
$ gdb ./mpclient

...

(gdb) x/10gx *($esi+0x130)
0x5813a328: 0x0000000000001337  0x0000000000004343
0x5813a338: 0x0000000000004444  0x0000000000004242
0x5813a348: 0x000000000012eea0  0x000000000012fff0
0x5813a358: 0x0000000000004646  0x0000000000004545
0x5813a368: 0x000000000012f840  0x0000000000000000
All we have to do now is to build a tiny script to xor everything up, and retrieve the flag:
#!/usr/bin/env python3

import struct

p64 = lambda x: struct.pack('<Q', x)

# Constants in the binary
cve_string = b'Reminder: patch CVE-2021-1647'
constants = [0xB9, 0x75, 0x4B, 0x6B, 0x78, 0xA0, 0x00, 0xC9, 0xCE, 0x9A, 0xEA, 0xD5, 0x6C, 0xBF, 0x78, 0x45, 0xC0, 0x9E, 0xE4, 0x7C, 0xED, 0xCE, 0x39, 0x46, 0x62, 0x6F, 0x52, 0x6A, 0x57]
# Dumped data from gdb
buf = p64(0xd7008c6d417553ad) + p64(0x0855b177c6dcd598) + p64(0x185c9aba25c0a4f6) + p64(0x0000001d7f00323d)

x = bytearray(0x1d)
for i in range(0x1d):
    x[i] = cve_string[i] ^ constants[i] ^ buf[i]
print(x.decode())
$ python3 offenders.py
FCSC{HelloFromEmulatedWorld!}
That's it!
Conclusion
The challenge was very fun and I learned a lot about Windows Defender even though this writeup is mostly about getting a quick win. There are many different ways of solving it and I hope you enjoyed this one :-)
Special thanks to the challenge author and the FCSC organisation team!